
What is Wireshark?
Wireshark is a popular protocol analyzer that users can use to troubleshoot network problems, examine network security issues, debug protocols, and learn network processes. It was designed to break down data packets transferred across different networks. Users can search and filter for specific data packets, and analyze how they traverse across their network. We can use these packets for analysis on a real-time or offline basis. Users can also use this information to generate graphs and statistics.
Over the past few years, it has become one of the most reliable protocol analyzers on the market, partly to it being an open-source project. Wireshark is used by experts and novices alike. The user interface is relatively simple once you understand the initial steps to capture packets. There are also in-depth tools available for advanced users.
Note: You should have some foundational networking knowledge before delving into Wireshark. These concepts will be hard to understand if you don’t.
Core Features
- Capture live packet data
- Import packets from text files
- View packet data and protocol information
- Save captured packet data
- Capture Filters
- Display Filters
- Colorize packets
- Generate Statistics
I will be going in to more detail on how to use these core features in Wireshark
Capture Data Packets
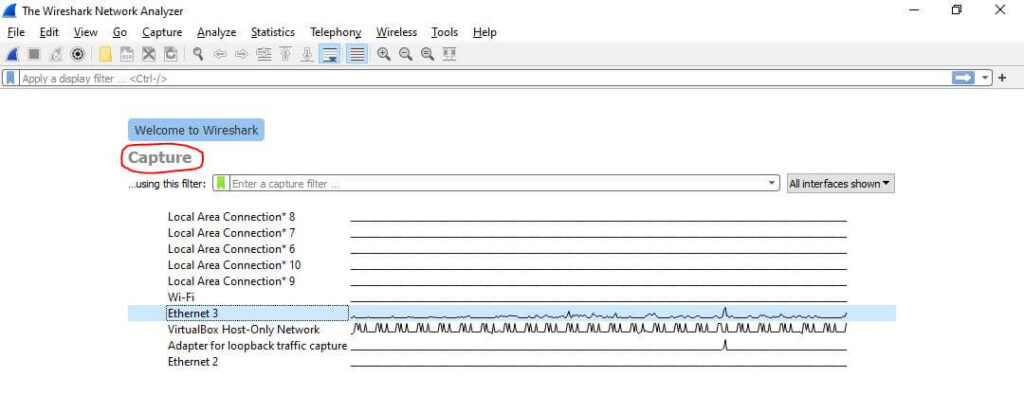
Before capturing packets, we need to ensure that your Wireshark application is running with administrator privileges. Once you have your Wireshark open, go to the menu bar and select Capture.
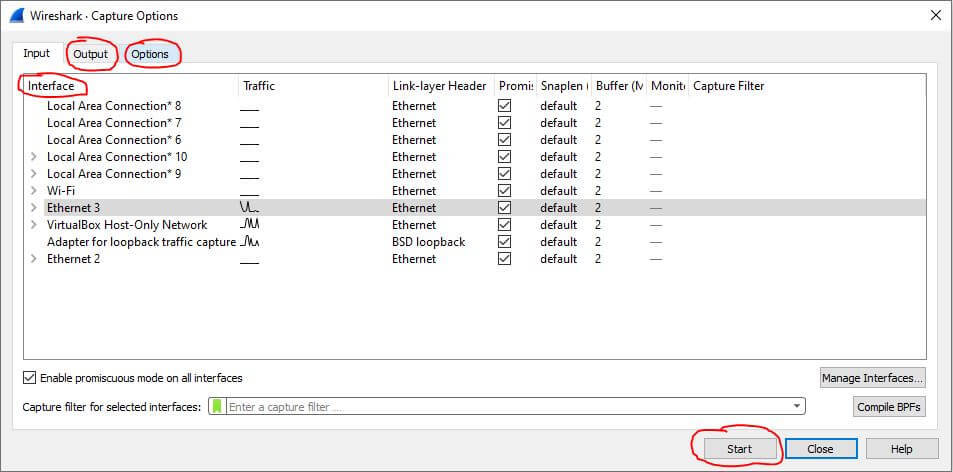
In the Capture Options, you can select your network interface, output options, and other miscellaneous options. For this guide, we will keep the default options set by Wireshark.
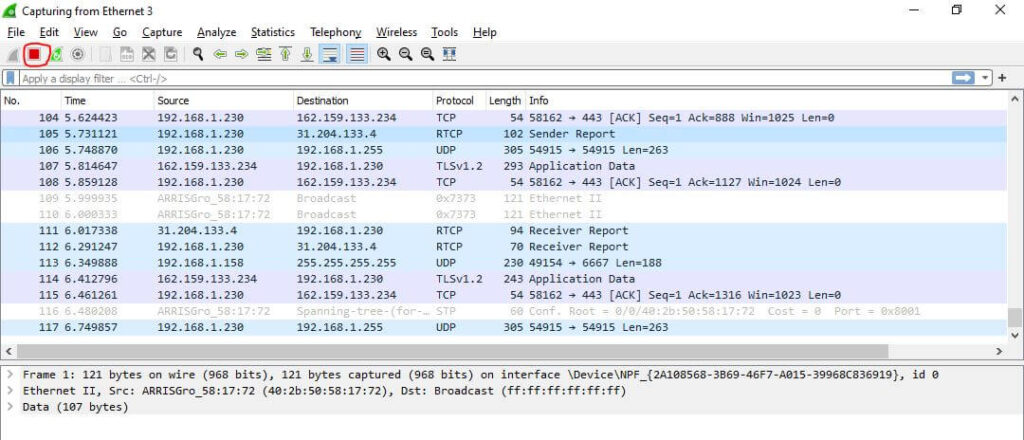
Choose the interface you want to capture packets from, then press Start on the bottom right of the window. You can see I have Ethernet 3 selected as my network interface below:
You can stop the packet capturing process by clicking on the red square button located at the top left of the window or by pressing Ctrl+E.
Import Packet Capture Files
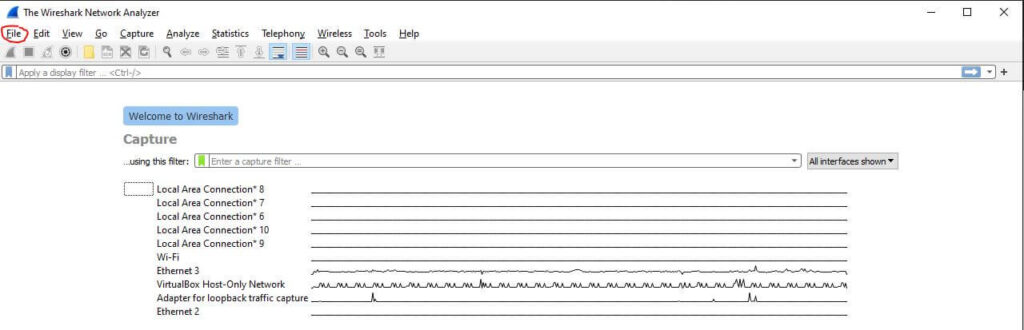
To import a capture file, we first have to open the File option at the top left of Wireshark and then click Open.
This will prompt a file selection menu which will allow you to navigate your files. Once you select your capture file, navigate to the bottom right and click Open again.
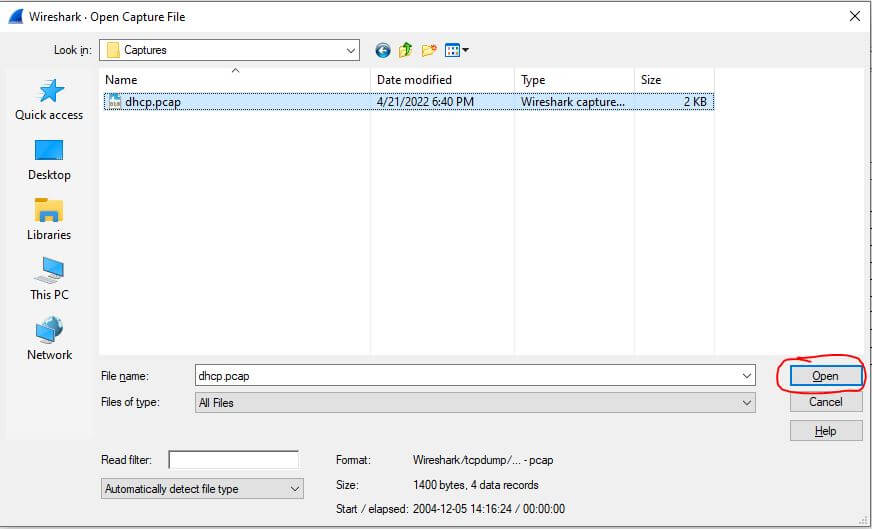
We now see the selected capture file is open.
Analyze Packet Data & Protocol Information
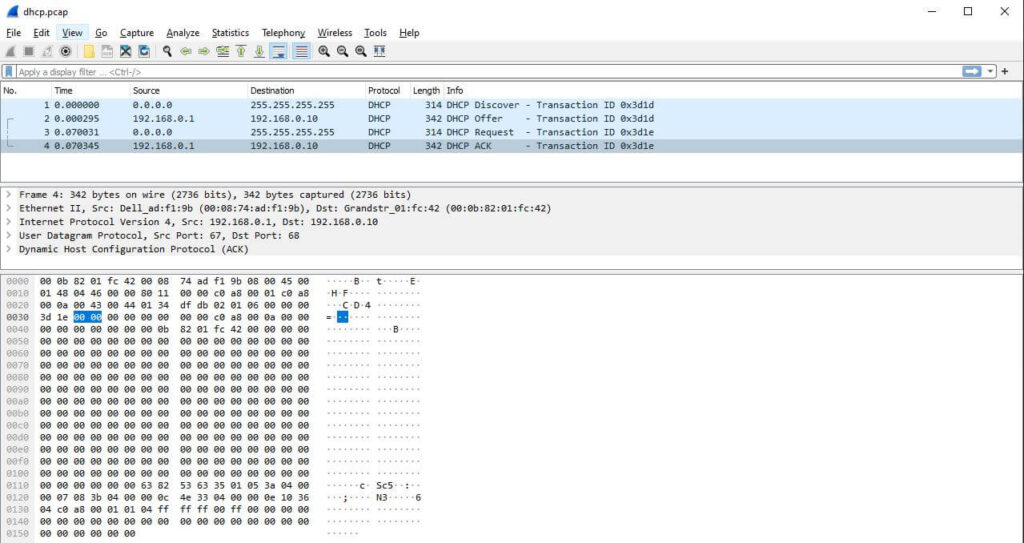
The captured data interface in Wireshark has three main sections:
- Packet list pane (Top section)
- Packet details pane (Middle section)
- Packet bytes pane (Bottom Section)
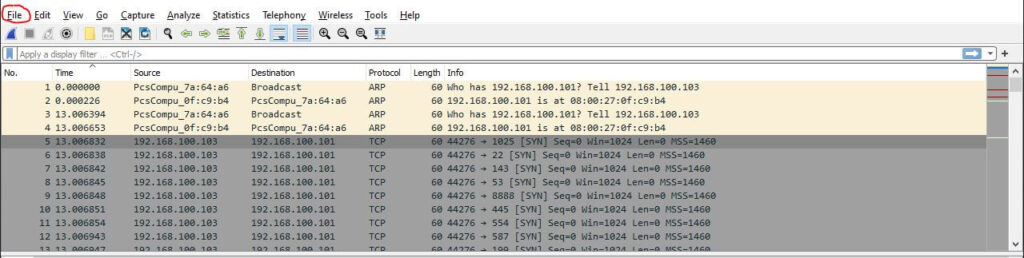
Packet List
This pane, located at the top of the Wireshark window, shows all packets captured during a network scan. Each packet has its own row and, categorized with these corresponding data points:
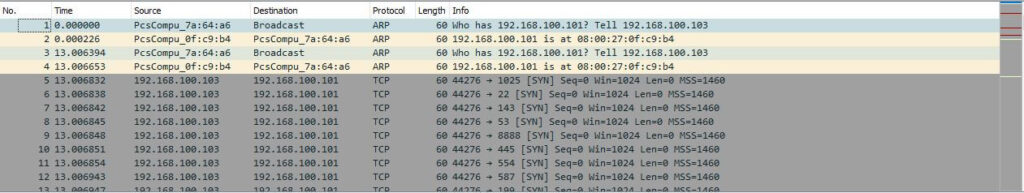
- No: This field represents the packet number. Packet number 1 is the first packet to be captured at the beginning of a network scan. It continues to rise as the number of packets grows.
- Time: Shows the timestamp of when the packet was captured. The number of seconds starts at 0 until the network capture has ended.
- Source: Contains the address of where the packet originated.
- Destination: Contains the address of the packet destination.
- Protocol: Shows the protocol used in the packet (ex: TCP).
- Length: Displays the packet length in bytes.
- Info: Additional details about the packet are shown here. Details can vary based on the packet contents.
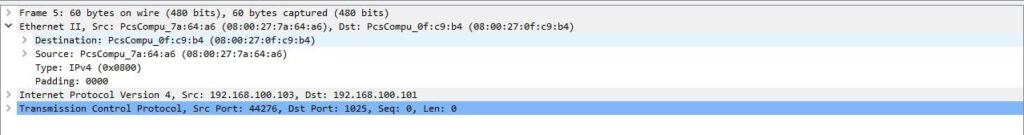
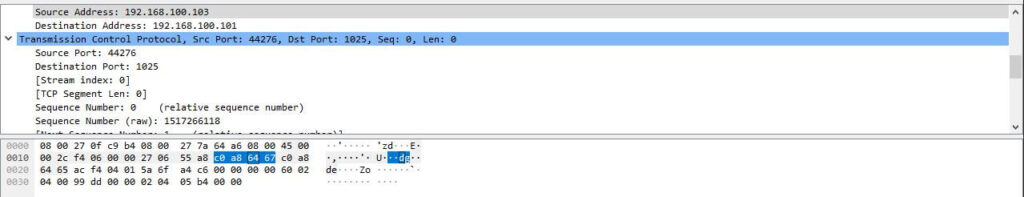
Packet Details
The details pane shows the protocols and protocol fields in a drop-down format. You can view helpful details like encapsulation type, source port, destination port, IPv4 or IPv6, etc…
Packet Bytes
At the bottom, we have the bytes pane, which displays the raw data in a hexadecimal view. If we select a specific portion of this hex dump, we see its corresponding information has also been selected in the packet details pane. Bytes that cannot be printed are represented by periods.
Save Captured Packets to a File
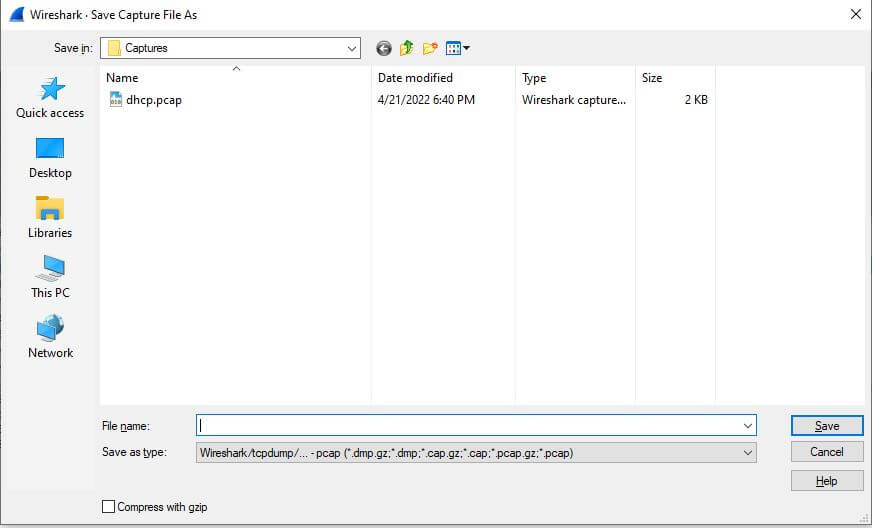
Once you are satisfied with the packets, you can save them to a file for later research. You can do this by first navigating to the top left and clicking on File
In the drop-down menu, select Save as. A window will appear where we can choose the file name and storage location. Lastly, select Save at the bottom right to save the file.
Display and Capture Filters
Capture Filters and Display Filters are two types of filters that a user can utilize in Wireshark.
Capture Filters are used to reduce the size of a live packet capture by filtering out specific packets. Essentially, capture filters are put in place before a packet capture starts and cannot be modified during the capture. Here is a link to a more in-depth guide on capture filters by Wireshark.
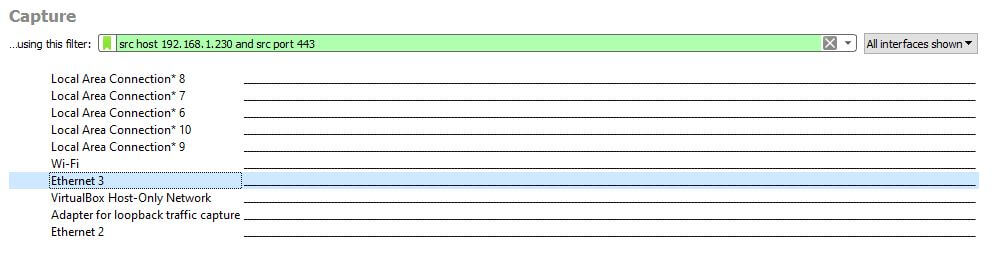
As an example, I am going to show you how to add the filter of a specific source address and port.
Here we see the capture filter menu. I have already placed the syntax for our capture filters and have our Ethernet 3 network interface selected(May be different for you). To start the capture, you can either click the shark fin icon at the top left, double click the selected network interface (Ethernet 3), or right-click the selected network interface and click Start capture.
On the other hand, display filters may be changed during a live packet capture and a recorded capture. Since display filters have different syntax, it will look slightly different from the capture filter. Here is a link to a more in-depth guide on display filters by Wireshark.
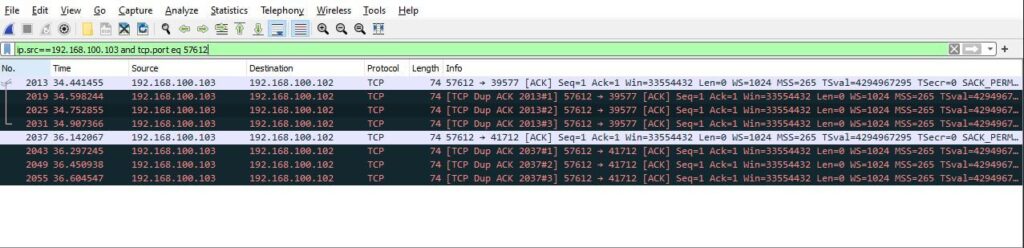
Again, I will show an example of how to use this type of filter by choosing a specific source address and port using the different syntax.
We can change the display filter by using the filter box below the toolbar. In the filter box, we have set the source address to 192.168.100.103 and the source port to 57612. To apply the filter, click on the arrow to the right of the filter box.
Color Rules
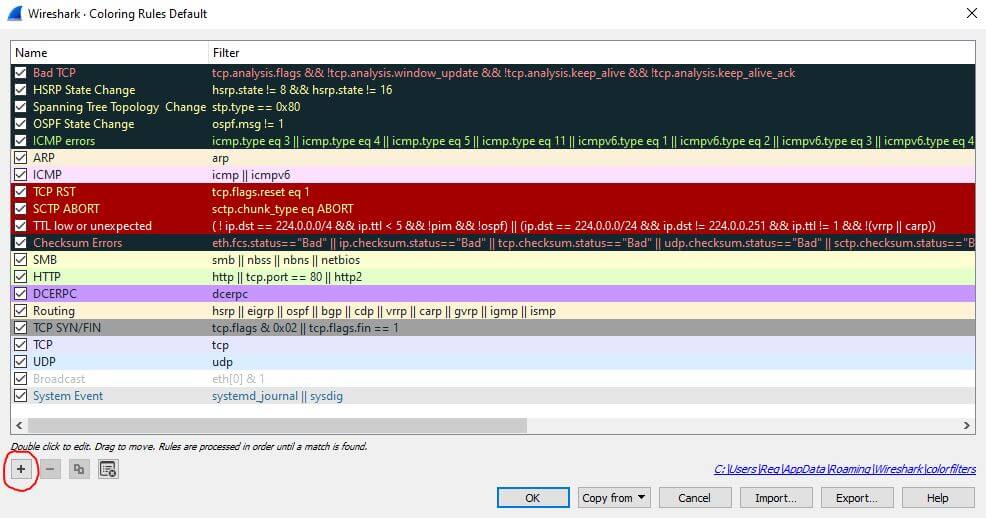
In addition to filtering, Wireshark provides another tool that helps users identify packets through color-coding. It allows you to distinguish between different packet types based on their hue.
Wireshark’s default settings has around 20 colors you can choose from. Navigate to the View Menu at the top of the window and select Coloring rules to edit these colors. You can also add your own color-based filters by selecting the “+” icon at the bottom left of the coloring rules.
Network Statistics
The statistics menu, located at the top of the screen, provides you with several metrics like graphs, timing information, size, etc… . You can also apply display filters to the statistics to help narrow down your search.
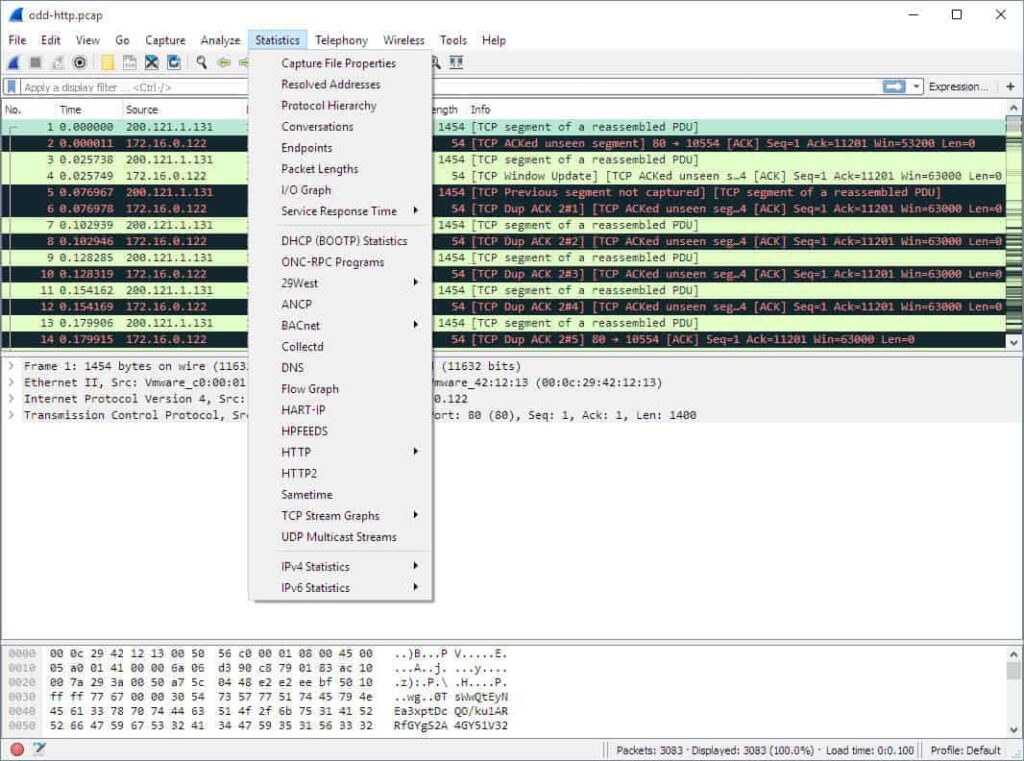
Here are some of the core options:
- Capture File Properties: Shows general information about the capture file like its entire path, size, cryptographic hashes, file format, and encapsulation.
- Protocol Hierarchy: This shows a complete table of all the protocols captured.
- Conversations: Displays network conversations between two endpoints.
- Endpoints: Lists all endpoints (An endpoint is where traffic of a specific protocol layer ends).
- IO Graphs: Create your visual representation of the data packets.
- Service Response Time: This shows the response time between a request and a response.